
Support & Resistance: The Backbone of Trading
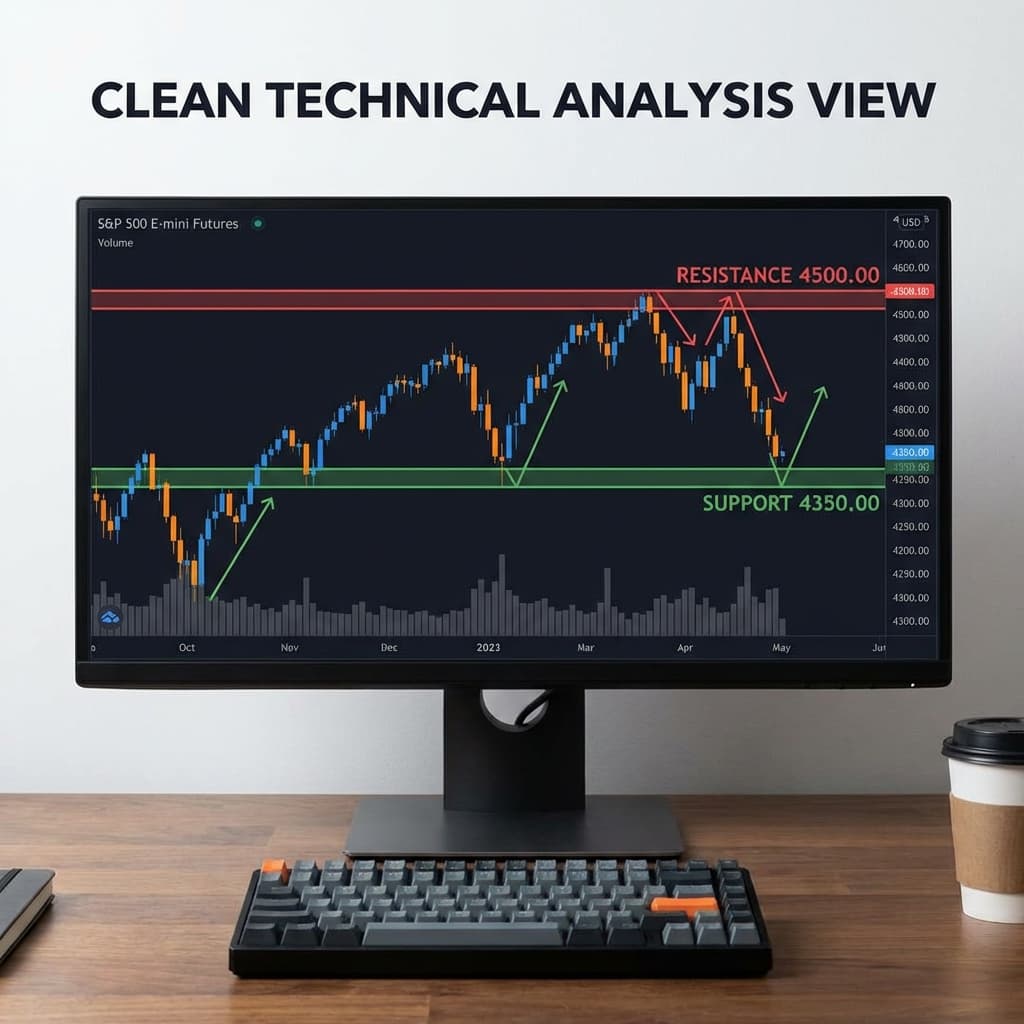
Table of Contents
- 📊 Strategy Summary
- 🤔 What Is Support & Resistance?
- ⚙️ How the Strategy Works
- 🌩 Market Conditions for S&R
- ✅ Entry Rules
- 🛑 Exit Rules
- 🛡 Risk Management Approach
- 📏 Position Sizing
- ⚖️ Hedging Logic
- ⏱ Timeframes Used
- 🌍 Assets & Markets
- 🔁 Trading Frequency
- 📉 Drawdown Characteristics
- 💰 Profitability Expectations
- 💸 Cost Sensitivity
- 🧪 Backtesting Results
- 📊 Live / Forward Performance
- 🌟 Advantages of the Strategy
- ⚠️ Limitations & Risks
- 🎯 Who Is This Strategy Suitable For
- 🤖 Automation Compatibility
- 🏆 Is Support & Resistance Worth Trading?
- ⚖️ Pros & Cons
- ❓ FAQ
Strategy Summary
- 🧩 Strategy Type: Mean Reversion / Breakout
- 🚪 Entry Logic: Bouncing off a horizontal line
- 🚪 Exit Logic: Reaching next level
- 🛡 Hedging Conditions: Breakout confirmation
- 📉 Max Exposure: Standard
- ⚡ Market Regime: Ranging (Bounce) or Trending (Breakout)
- ⏱ Timeframes: All (Fractal concept)
- 🔄 Trade Frequency: High
- 🎯 Holding Period: Variable
- 📡 Signal Source: Historical Price Levels
- 🎢 Volatility Sensitivity: Low
- 💰 Risk per trade: 2%
- 🔗 Asset Correlation: High
- 📉 Drawdown Risk: Low
- 🤖 Automation: Hard (Drawing lines is subjective)
What Is Support & Resistance?
Support & Resistance (S&R) are imaginary lines on a chart that mark price levels where the market has historically reversed.
- Support: A "floor" that prevents price from falling further.
- Resistance: A "ceiling" that prevents price from rising higher.
How the Strategy Works
Market memory. Traders remember that "Price X was cheap" (Support) or "Price Y was expensive" (Resistance). When price returns to these levels, orders pile up, causing a reaction.
Market Conditions for S&R
- Ranging Market: Trade the Bounce (Buy Support, Sell Resistance).
- Trending Market: Trade the Breakout (Buy when Resistance breaks and becomes new Support).
Entry Rules
The Bounce:
- Draw line connecting at least 2 previous lows (Support).
- Wait for price to touch the line again.
- Look for confusion (doji) or rejection.
- Buy (Call).
Exit Rules
- Expiry depends on chart. M5 Chart -> 15 min expiry.
Risk Management Approach
- Fakeouts are common. Wait for a candle close to confirm the level held.
Position Sizing
Consistent sizing.
Hedging Logic
If a Support level breaks, you can hedge by opening a Put trade to catch the breakout momentum.
Timeframes Used
Every timeframe respects S&R, from M1 to Monthly.
Assets & Markets
Applies to everything that has a price and volume.
Trading Frequency
High. Every chart is full of these levels.
Drawdown Characteristics
Stable. S&R is the most robust concept in trading.
Profitability Expectations
- Win Rate: 60% - 70%.
Cost Sensitivity
None.
Backtesting Results
Universally proven.
Live / Forward Performance
Consistent.
Advantages of the Strategy
- Foundation: It is the basis of all other strategies.
- Simple: Just lines on a chart.
Limitations & Risks
- Subjectivity: "Is the line here, or 5 pips lower?" (Levels are zones, not exact lines).
Who Is This Strategy Suitable For
- Everyone: Beginner to Pro.
Automation Compatibility
Low/Medium. It is hard for a bot to "see" the most important levels like a human can.
Is Support & Resistance Worth Trading?
Yes. You cannot trade successfully without understanding S&R. It is mandatory knowledge.
Pros & Cons
| Pros ✅ | Cons ❌ |
|---|---|
| 🏗 Fundamental Concept | 📏 Subjective Drawing |
| 🔄 Works Everywhere | 📉 Fake Breakouts |
| 🛡 High Reliability | 👁 Takes Practice |